
Live Nation Entertainment (NYSE: LYV) reported its Q3 2021 earnings Thursday, and as expected, they reflected a strong return in the live events business. The company touted a return for all business segments to positive operating income – a first since the start of the COVID-19 pandemic – with operating income and AOI of $137 million and $306 million, respectively.
For consumers, that hot reopening has allowed the massive promoter at the center of the live events industry (and through its Ticketmaster subsidiary, the holder of a massive percentage of the live event ticketing bsuiness as well), to push prices ever-higher as live events have returned. Average amphitheater and major festival pricing was up by double digits compared to 2019, with fans spending more once inside the venues as well, to the tune of a per-consumer increase of more than 20 percent compared to 2019.
“As we get close to turning the page on 2021, I remain more convinced than ever on the power and potential of live entertainment, and the strength of our position,” says President and CEO Michael Rapino in the earnings release. “No industry was more impacted by the pandemic over the last two years, and no industry has so proven its durability of demand in the face of such disruption.”
Ticketmaster results were strong on their own – with the company delivering its highest operating income and AOI quarter in its history. Its resale business also had a record month in September, “showing continued growth in the segment even as artists and content owners continue shifting more of the value to primary sales,” according to the release – indicating the continuing shift to ever-higher prices to the consumer at the initial primary market sale through the use of “platinum” and dynamic pricing.
Looking forward to 2022, the company forecasted strong numbers to come as consumers increasingly return to live events as pandemic-related restrictions (hopefully) wind down into 2022.
“I fully expect we will continue to have bumps in the road in the coming months, and it will take some time for international artists to be touring on a truly global basis, but the fundamental strength of live entertainment and Live Nation has proven out, and I expect we will only continue to grow from here,” Rapino says.
Stock prices for Live Nation Entertainment have never been higher – LYV opened Friday morning at over $117, 66% above its value at the start of 2021 and almost four times its March 2020 low of $34 during the initial COVID shutdown of live events.
The full earnings release is included below:
Live Nation Entertainment Reports Third Quarter 2021 Results
- All Business Segments Returned to Positive Operating Income and AOI Resulting in Company-Wide Operating Income of $137 million and AOI of $306 million
- Ticketmaster Delivered its Highest Operating Income and AOI Quarter Ever at $114 million and $172 million, respectively
- Fan Demand Led to Double-Digit Growth in Pricing and On-Site Spending
- The Return to Live is Accelerating with Show Count Up Double-Digits for 2022 Relative to This Time in 2019
- Sponsorship Commitments for 2022 Are Up Double-Digits Relative to This Time in 2019
Live Nation Entertainment, Inc. (NYSE: LYV) today released financial results for the quarter ended September 30, 2021.
Third quarter marked return to live at scale
Live music roared back over the past quarter, driving all our business segments to positive operating income and AOI for the first time in two years, with a company-wide operating income and AOI of $137 million and $306 million, respectively.
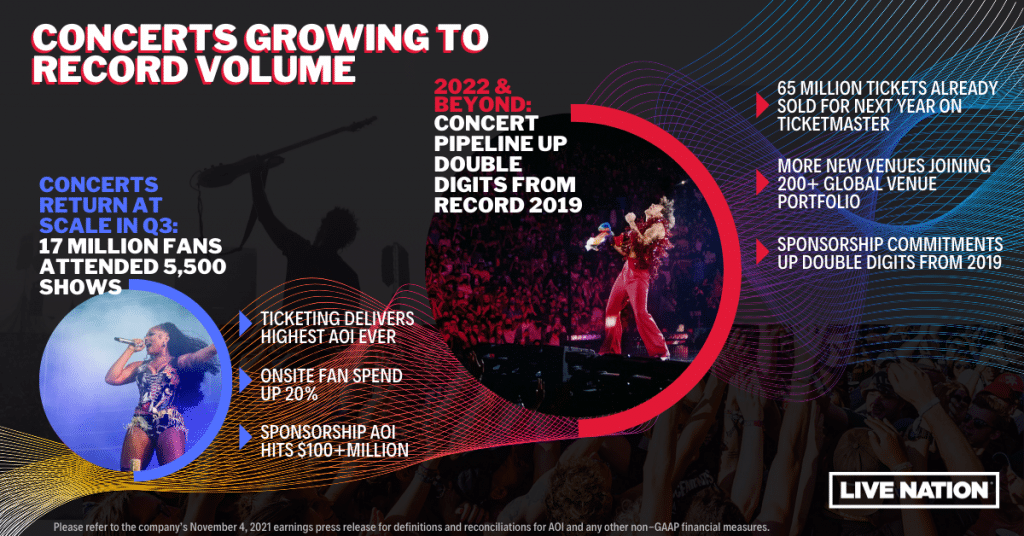
The 2021 summer concerts season rebounded quickly, with 17 million fans attending our shows in the quarter, as the return to live reflected tremendous pent-up demand. Festivals were a large part of our return to live this summer, with many of our festivals selling out in record time and overall ticket sales for major festivals were up 10% versus 2019. And we have had a number of tours already sell over 500 thousand tickets for shows this year, including sell-out tours by Harry Styles, Chris Stapleton and others.
In addition to increased attendance, strong demand also enabled improved pricing, with average amphitheater and major festival pricing up double-digits versus 2019. And at our shows, fans spent at record levels, with on-site spending per fan up over 20% in amphitheaters and festivals compared to 2019.
We delivered these results within an operating environment that required us to ramp up quickly, institute new health and safety protocols, and staff our front line in a tight labor market. On the health and safety front, we set the industry standard by requiring proof of vaccine or testing for our shows, with no change in fan purchasing behavior. More importantly, our protocols proved effective in mitigating major Covid disruptions to our business in the U.S. and the U.K. and allowed us to work in conjunction with local health officials to mitigate transmission risks from our events. On the labor front, we were able to meet staffing requirements for our peak outdoor season without any show disruption.
We also saw strong fan demand in our Ticketmaster results, which delivered its highest operating income and AOI quarter ever. Third quarter was Ticketmaster’s fourth highest fee-bearing GTV quarter ever excluding refunds, led by sports leagues restarting and concert on-sales for 2022 ramping up. In addition, Ticketmaster’s secondary business delivered its highest GTV month in September, showing continued growth in the segment even as artists and content owners continue shifting more of the value to primary sales.
As fans came back, so too did our brand partners who continue to seek to connect to the live music fans. As a result, our sponsorship and advertising business delivered over $100 million in operating income and AOI in the quarter, the first time at this level since third quarter of 2019. The return of sponsorship and advertising has been largely driven by our historical major partners, along with the addition of new brands including Truly Hard Seltzer, as well as Coinbase and Solana in the fintech space.
Leading indicators point to a record 2022
As we now look forward to 2022, we are encouraged by all our leading indicators across each business. Through October, our confirmed show count across amphitheaters, arenas and stadiums is up double-digits relative to the same time in 2019 for 2020 shows, and through mid-October, we have already sold 22 million tickets for our shows in 2022. Demand has been stronger than ever for many of these on-sales with one million tickets sold for each Coldplay and Red Hot Chili Peppers tours, and several other tours already selling over 500 thousand tickets.
Ticketmaster’s on-sales for 2022 reinforce this demand, as we expect the 2021 fourth quarter transacted fee-bearing GTV to be at a record level, even after already selling 65 million fee-bearing tickets for events next year. Ticketmaster has also added clients representing 14 million net new fee-bearing tickets so far this year, further accelerating its growth on a global basis.
Our sponsorship and advertising business has had similar success with its clients, with our confirmed pipeline for 2022 up double-digits relative to this time in 2019 for 2020.
At the same time, we are continuing our cost focus to deliver $200 million in structural savings from our pre-pandemic 2020 plan, making us more nimble and better positioned to invest for future growth.
As we get close to turning the page on 2021, I remain more convinced than ever on the power and potential of live entertainment, and the strength of our position. No industry was more impacted by the pandemic over the last two years, and no industry has so proven its durability of demand in the face of such disruption.
I fully expect we will continue to have bumps in the road in the coming months, and it will take some time for international artists to be touring on a truly global basis, but the fundamental strength of live entertainment and Live Nation has proven out, and I expect we will only continue to grow from here.
Michael Rapino
President and Chief Executive Officer
Live Nation Entertainment, Inc.
|
FINANCIAL HIGHLIGHTS – THIRD QUARTER (unaudited; $ in millions) |
|||||||||||||||||
|
Q3 2021 Reported |
Q3 2020 Reported |
Growth |
Q3 2021 Constant Currency |
Growth at |
|||||||||||||
|
Revenue |
|||||||||||||||||
|
Concerts |
$ |
2,151.6 |
$ |
154.8 |
* |
$ |
2,132.5 |
* |
|||||||||
|
Ticketing |
374.2 |
(19.8) |
* |
372.3 |
* |
||||||||||||
|
Sponsorship & Advertising |
174.4 |
47.9 |
* |
172.6 |
* |
||||||||||||
|
Other and Eliminations |
(1.7) |
1.1 |
* |
(1.6) |
* |
||||||||||||
|
$ |
2,698.5 |
$ |
184.0 |
* |
$ |
2,675.8 |
* |
||||||||||
|
Operating Income (Loss) |
|||||||||||||||||
|
Concerts |
$ |
(32.8) |
$ |
(281.6) |
88 |
% |
$ |
(33.4) |
88 |
% |
|||||||
|
Ticketing |
114.3 |
(197.4) |
* |
114.9 |
* |
||||||||||||
|
Sponsorship & Advertising |
102.8 |
13.8 |
* |
101.3 |
* |
||||||||||||
|
Other and Eliminations |
(0.1) |
(4.8) |
98 |
% |
0.1 |
* |
|||||||||||
|
Corporate |
(47.1) |
(34.4) |
(37) |
% |
(47.1) |
(37) |
% |
||||||||||
|
$ |
137.1 |
$ |
(504.4) |
* |
$ |
135.8 |
* |
||||||||||
|
Adjusted Operating Income (Loss) |
|||||||||||||||||
|
Concerts |
$ |
59.6 |
$ |
(173.4) |
* |
$ |
58.2 |
* |
|||||||||
|
Ticketing |
171.8 |
(141.9) |
* |
171.8 |
* |
||||||||||||
|
Sponsorship & Advertising |
111.2 |
22.9 |
* |
109.8 |
* |
||||||||||||
|
Other and Eliminations |
(1.2) |
(5.1) |
76 |
% |
(1.2) |
76 |
% |
||||||||||
|
Corporate |
(35.7) |
(21.7) |
(65) |
% |
(35.7) |
(65) |
% |
||||||||||
|
$ |
305.7 |
$ |
(319.2) |
* |
$ |
302.9 |
* |
||||||||||
|
* percentages are not meaningful |
|||||||||||||||||
|
FINANCIAL HIGHLIGHTS – NINE MONTHS (unaudited; $ in millions) |
||||||||||||||||||
|
9 Months |
9 Months |
Growth |
9 Months |
Growth at |
||||||||||||||
|
Revenue |
||||||||||||||||||
|
Concerts |
$ |
2,678.0 |
$ |
1,290.0 |
* |
$ |
2,642.6 |
* |
||||||||||
|
Ticketing |
646.6 |
177.4 |
* |
639.2 |
* |
|||||||||||||
|
Sponsorship & Advertising |
241.7 |
156.6 |
54 |
% |
237.8 |
52 |
% |
|||||||||||
|
Other and Eliminations |
(0.9) |
(0.2) |
* |
(0.9) |
* |
|||||||||||||
|
$ |
3,565.4 |
$ |
1,623.8 |
* |
$ |
3,518.7 |
* |
|||||||||||
|
Operating Income (Loss) |
||||||||||||||||||
|
Concerts |
$ |
(324.5) |
$ |
(722.6) |
55 |
% |
$ |
(316.6) |
56 |
% |
||||||||
|
Ticketing |
37.4 |
(480.5) |
* |
43.3 |
* |
|||||||||||||
|
Sponsorship & Advertising |
101.6 |
40.8 |
* |
99.4 |
* |
|||||||||||||
|
Other and Eliminations |
(0.1) |
(13.0) |
99 |
% |
(0.1) |
99 |
% |
|||||||||||
|
Corporate |
(107.7) |
(89.9) |
20 |
% |
(107.8) |
(20) |
% |
|||||||||||
|
$ |
(293.3) |
$ |
(1,265.2) |
77 |
% |
$ |
(281.8) |
78 |
% |
|||||||||
|
Adjusted Operating Income (Loss) |
||||||||||||||||||
|
Concerts |
$ |
(99.0) |
$ |
(472.3) |
79 |
% |
$ |
(96.7) |
80 |
% |
||||||||
|
Ticketing |
208.4 |
(300.8) |
* |
210.0 |
* |
|||||||||||||
|
Sponsorship & Advertising |
127.8 |
67.7 |
89 |
% |
125.6 |
85 |
% |
|||||||||||
|
Other and Eliminations |
(4.6) |
(11.7) |
61 |
% |
(4.6) |
61 |
% |
|||||||||||
|
Corporate |
(69.0) |
(54.5) |
(27) |
% |
(69.0) |
(27) |
% |
|||||||||||
|
$ |
163.6 |
$ |
(771.6) |
* |
$ |
165.3 |
* |
|||||||||||
|
* percentages are not meaningful |
||||||||||||||||||
- As of September 30, 2021, total cash and cash equivalents were $4.6 billion, which includes $1.3 billion in ticketing client cash and $1.7 billion in free cash. This free cash, along with $571 million of available debt capacity, gives the company $2.3 billion of available liquidity. The company believes this level of liquidity will provide it with the runway it needs as more shows returns.
- Event-related deferred revenue was $1.9 billion as of September 30, 2021 compared to $1.4 billion as of September 30, 2020. In addition, the company had long-term deferred revenue of $101 million for events scheduled more than one year out as of September 30, 2021.
- For the nine months ended September 30, 2021, net cash provided by operating activities was $1.0 billion and free cash flow — adjusted was $(129.9) million.
- The company currently expects capital expenditures for the full year to be approximately $185 million in 2021, with over 60% of this spend going into revenue generating projects.
|
KEY OPERATING METRICS (unaudited) |
|||||||||||
|
Q3 2021 |
Q3 2020 |
9 Months 2021 |
9 Months 2020 |
||||||||
|
(in thousands except estimated events) |
|||||||||||
|
Concerts (1) |
|||||||||||
|
Estimated events: |
|||||||||||
|
North America |
4,235 |
219 |
5,695 |
5,016 |
|||||||
|
International |
1,328 |
141 |
2,252 |
2,571 |
|||||||
|
Total estimated events |
5,563 |
360 |
7,947 |
7,587 |
|||||||
|
Estimated fans: |
|||||||||||
|
North America |
13,425 |
204 |
14,151 |
5,943 |
|||||||
|
International |
3,427 |
61 |
4,562 |
4,779 |
|||||||
|
Total estimated fans |
16,852 |
265 |
18,713 |
10,722 |
|||||||
|
Ticketing (2) |
|||||||||||
|
Estimated number of fee-bearing tickets |
43,296 |
1,323 |
76,222 |
28,658 |
|||||||
|
Estimated number of non-fee-bearing tickets |
39,798 |
8,392 |
78,174 |
70,031 |
|||||||
|
Total estimated tickets sold |
83,094 |
9,715 |
154,396 |
98,689 |
|||||||
|
_________ |
||||||||||||
|
(1) |
Events generally represent a single performance by an artist. Fans generally represent the number of people who attend an event. Festivals are counted as one event in the quarter in which the festival begins, but the number of fans is based on the days the fans were present at the festival and thus can be reported across multiple quarters. Events and fan attendance metrics are estimated each quarter. |
|||||||||||
|
(2) |
The fee-bearing tickets estimated above include primary and secondary tickets that are sold using our Ticketmaster systems or that we issue through affiliates. This metric includes primary tickets sold during the period regardless of event timing, except for our own events where our concert promoters control ticketing which are reported when the events occur. The non-fee-bearing tickets estimated above include primary tickets sold using our Ticketmaster systems, through season seat packages and our venue clients’ box offices, along with tickets sold on our “do it yourself” platform. These ticketing metrics are net of any refunds requested and any cancellations that occurred during the period and up to the time of reporting of these consolidated financial statements, which may result in a negative number. Fee-bearing tickets sold above are net of refunds of 5.8 million and 5.2 million tickets for the three months ended September 30, 2021 and 2020, respectively, and 12.9 million and 23.2 million tickets for the nine months ended September 30, 2021 and 2020, respectively. |
|||||||||||
|
Reconciliation of Certain Non-GAAP Measures to Their Most Directly Comparable GAAP Measures (Unaudited) |
|||||||
|
Reconciliation of Free Cash Flow — Adjusted to Net Cash Provided by (Used in) Operating Activities |
|||||||
|
($ in millions) |
Q3 2021 |
Q3 2020 |
|||||
|
Net cash used in operating activities |
$ |
(145.3) |
$ |
(566.5) |
|||
|
Less: Changes in operating assets and liabilities (working capital) |
356.8 |
223.9 |
|||||
|
Free cash flow from earnings |
$ |
211.5 |
$ |
(342.6) |
|||
|
Less: Maintenance capital expenditures |
(22.9) |
(10.3) |
|||||
|
Distributions to noncontrolling interests |
(11.1) |
(5.2) |
|||||
|
Free cash flow — adjusted |
$ |
177.5 |
$ |
(358.1) |
|||
|
Net cash used in investing activities |
$ |
(61.5) |
$ |
(33.9) |
|||
|
Net cash provided by (used in) financing activities |
$ |
820.8 |
$ |
(100.5) |
|||
|
($ in millions) |
9 Months 2021 |
9 Months 2020 |
|||||
|
Net cash provided by (used in) operating activities |
$ |
1,024.7 |
$ |
(956.9) |
|||
|
Less: Changes in operating assets and liabilities (working capital) |
(1,091.8) |
120.9 |
|||||
|
Free cash flow from earnings |
$ |
(67.1) |
$ |
(836.0) |
|||
|
Less: Maintenance capital expenditures |
(37.2) |
(56.0) |
|||||
|
Distributions to noncontrolling interests |
(25.6) |
(31.5) |
|||||
|
Free cash flow — adjusted |
$ |
(129.9) |
$ |
(923.5) |
|||
|
Net cash used in investing activities |
$ |
(111.8) |
$ |
(224.5) |
|||
|
Net cash provided by financing activities |
$ |
1,222.3 |
$ |
1,361.6 |
|||
|
Reconciliation of Free Cash to Cash and Cash Equivalents |
|||
|
($ in millions) |
September 30, |
||
|
Cash and cash equivalents |
$ |
4,628.9 |
|
|
Client cash |
(1,259.3) |
||
|
Deferred revenue — event-related |
(1,869.2) |
||
|
Accrued artist fees |
(69.1) |
||
|
Collections on behalf of others |
(87.1) |
||
|
Prepaid expenses — event-related |
402.6 |
||
|
Free cash |
$ |
1,746.8 |
|
Forward-Looking Statements, Non-GAAP Financial Measures and Reconciliations:
Certain statements in this press release, including the Supplemental Information that follows, constitute “forward-looking statements” within the meaning of the Private Securities Litigation Reform Act of 1995. Such forward-looking statements include, but are not limited to statements regarding leading indicators pointing to a record 2022; the company’s current expectations for fourth quarter 2021 transacted gross transaction value (GTV) in its Ticketmaster business; the company’s cost focus and anticipated $200 million in structural savings from its pre-pandemic 2020 plan; the strength of the company’s positioning and prospects for future growth; the company’s belief that its level of liquidity will provide it with the runway it needs as more shows return; the company’s current expectations for capital expenditures for 2021; and estimated additional fan refunds for the year. Live Nation wishes to caution you that there are some known and unknown factors that could cause actual results to differ materially from any future results, performance or achievements expressed or implied by such forward-looking statements, including but not limited to operational challenges in achieving strategic objectives and executing on the company’s plans, the risk that the company’s markets do not evolve as anticipated, the potential impact of any economic slowdown and operational challenges associated with selling tickets and staging events.
Live Nation refers you to the documents it files from time to time with the U.S. Securities and Exchange Commission, or SEC, specifically the section titled “Item 1A. Risk Factors” of the company’s most recent Annual Report filed on Form 10-K, and Quarterly Reports on Form 10-Q and its Current Reports on Form 8-K, which contain and identify other important factors that could cause actual results to differ materially from those contained in the company’s projections or forward-looking statements. You are cautioned not to place undue reliance on these forward-looking statements which speak only as of the date on which they are made. All subsequent written and oral forward-looking statements by or concerning Live Nation are expressly qualified in their entirety by the cautionary statements above. Live Nation does not undertake any obligation to publicly update or revise any forward-looking statements because of new information, future events or otherwise.
This press release contains certain non-GAAP financial measures as defined by SEC Regulation G. A reconciliation of each such measure to its most directly comparable GAAP financial measure, together with an explanation of why management believes that these non-GAAP financial measures provide useful information to investors, is provided herein.
Adjusted Operating Income (Loss), or AOI, is a non-GAAP financial measure that we define as operating income (loss) before certain stock-based compensation expense, loss (gain) on disposal of operating assets, depreciation and amortization (including goodwill impairment), amortization of non-recoupable ticketing contract advances and acquisition expenses (including transaction costs, changes in the fair value of accrued acquisition-related contingent consideration obligations, and acquisition-related severance and compensation). We use AOI to evaluate the performance of our operating segments. We believe that information about AOI assists investors by allowing them to evaluate changes in the operating results of our portfolio of businesses separate from non-operational factors that affect net income (loss), thus providing insights into both operations and the other factors that affect reported results. AOI is not calculated or presented in accordance with GAAP. A limitation of the use of AOI as a performance measure is that it does not reflect the periodic costs of certain amortizing assets used in generating revenue in our business. Accordingly, AOI should be considered in addition to, and not as a substitute for, operating income (loss), net income (loss), and other measures of financial performance reported in accordance with GAAP. Furthermore, this measure may vary among other companies; thus, AOI as presented herein may not be comparable to similarly titled measures of other companies.
Constant Currency is a non-GAAP financial measure. We calculate currency impacts as the difference between current period activity translated using the current period’s currency exchange rates and the comparable prior period’s currency exchange rates. We present constant currency information to provide a framework for assessing how our underlying businesses performed excluding the effect of foreign currency rate fluctuations.
Free Cash Flow — Adjusted, or FCF, is a non-GAAP financial measure that we define as net cash provided by (used in) operating activities less changes in operating assets and liabilities, less maintenance capital expenditures, less distributions to noncontrolling interest partners. We use FCF among other measures, to evaluate the ability of operations to generate cash that is available for purposes other than maintenance capital expenditures. We believe that information about FCF provides investors with an important perspective on the cash available to service debt, make acquisitions, and for revenue generating capital expenditures. FCF is not calculated or presented in accordance with GAAP. A limitation of the use of FCF as a performance measure is that it does not necessarily represent funds available for operations and is not necessarily a measure of our ability to fund our cash needs. Accordingly, FCF should be considered in addition to, and not as a substitute for, net cash provided by (used in) operating activities and other measures of financial performance reported in accordance with GAAP. Furthermore, this measure may vary among other companies; thus, FCF as presented herein may not be comparable to similarly titled measures of other companies.
Free Cash is a non-GAAP financial measure that we define as cash and cash equivalents less ticketing-related client funds, less event-related deferred revenue, less accrued expenses due to artists and cash collected on behalf of others, plus event-related prepaids. We use free cash as a proxy for how much cash we have available to, among other things, optionally repay debt balances, make acquisitions and fund revenue generating capital expenditures. Free cash is not calculated or presented in accordance with GAAP. A limitation of the use of free cash as a performance measure is that it does not necessarily represent funds available from operations and it is not necessarily a measure of our ability to fund our cash needs. Accordingly, free cash should be considered in addition to, and not as a substitute for, cash and cash equivalents and other measures of financial performance reported in accordance with GAAP. Furthermore, this measure may vary among other companies; thus, free cash as presented herein may not be comparable to similarly titled measures of other companies.
|
Reconciliations of Certain Non-GAAP Measures to Their Most Directly Comparable GAAP Measures (Unaudited) |
|||||||||||||||||||||||||||||||||||
|
Reconciliation of Adjusted Operating Income (Loss) to Operating Income (Loss) |
|||||||||||||||||||||||||||||||||||
|
($ in millions) |
Operating income (loss) |
Stock-based compensation expense |
Loss (gain) on disposal of operating assets |
Depreciation and amortization |
Amortization of non-recoupable ticketing contract advances |
Acquisition expenses |
Adjusted operating income (loss) reported |
Foreign exchange impact |
Adjusted operating income (loss) constant currency |
||||||||||||||||||||||||||
|
Three Months Ended September 30, 2021 |
|||||||||||||||||||||||||||||||||||
|
Concerts |
$ |
(32.8) |
$ |
14.2 |
$ |
(1.1) |
$ |
59.5 |
$ |
— |
$ |
19.8 |
$ |
59.6 |
$ |
(1.4) |
$ |
58.2 |
|||||||||||||||||
|
Ticketing |
114.3 |
3.3 |
(0.1) |
32.0 |
21.7 |
0.6 |
171.8 |
— |
171.8 |
||||||||||||||||||||||||||
|
Sponsorship & |
102.8 |
1.3 |
— |
7.2 |
— |
(0.1) |
111.2 |
(1.4) |
109.8 |
||||||||||||||||||||||||||
|
Other & |
(0.1) |
— |
— |
— |
(1.2) |
0.1 |
(1.2) |
— |
(1.2) |
||||||||||||||||||||||||||
|
Corporate |
(47.1) |
8.5 |
0.1 |
2.5 |
— |
0.3 |
(35.7) |
— |
(35.7) |
||||||||||||||||||||||||||
|
Total Live Nation |
$ |
137.1 |
$ |
27.3 |
$ |
(1.1) |
$ |
101.2 |
$ |
20.5 |
$ |
20.7 |
$ |
305.7 |
$ |
(2.8) |
$ |
302.9 |
|||||||||||||||||
|
Three Months Ended September 30, 2020 |
|||||||||||||||||||||||||||||||||||
|
Concerts |
$ |
(281.6) |
$ |
39.6 |
$ |
0.2 |
$ |
65.8 |
$ |
— |
$ |
2.6 |
$ |
(173.4) |
$ |
— |
$ |
(173.4) |
|||||||||||||||||
|
Ticketing |
(197.4) |
5.4 |
— |
42.6 |
9.2 |
(1.7) |
(141.9) |
— |
(141.9) |
||||||||||||||||||||||||||
|
Sponsorship & Advertising |
13.8 |
2.5 |
— |
6.6 |
— |
— |
22.9 |
— |
22.9 |
||||||||||||||||||||||||||
|
Other & Eliminations |
(4.8) |
— |
— |
2.2 |
(2.5) |
— |
(5.1) |
— |
(5.1) |
||||||||||||||||||||||||||
|
Corporate |
(34.4) |
9.2 |
— |
2.7 |
— |
0.8 |
(21.7) |
— |
(21.7) |
||||||||||||||||||||||||||
|
Total Live Nation |
$ |
(504.4) |
$ |
56.7 |
$ |
0.2 |
$ |
119.9 |
$ |
6.7 |
$ |
1.7 |
$ |
(319.2) |
$ |
— |
$ |
(319.2) |
|||||||||||||||||
|
Nine Months Ended September 30, 2021 |
|||||||||||||||||||||||||||||||||||
|
Concerts |
$ |
(324.5) |
$ |
34.2 |
$ |
(1.0) |
$ |
180.9 |
$ |
— |
$ |
11.4 |
$ |
(99.0) |
$ |
2.3 |
$ |
(96.7) |
|||||||||||||||||
|
Ticketing |
37.4 |
12.2 |
(0.1) |
103.4 |
53.8 |
1.7 |
208.4 |
1.6 |
210.0 |
||||||||||||||||||||||||||
|
Sponsorship & Advertising |
101.6 |
4.3 |
— |
21.8 |
— |
— |
127.8 |
(2.2) |
125.6 |
||||||||||||||||||||||||||
|
Other & Eliminations |
(0.1) |
— |
— |
0.1 |
(4.6) |
— |
(4.6) |
— |
(4.6) |
||||||||||||||||||||||||||
|
Corporate |
(107.7) |
29.5 |
0.1 |
7.6 |
— |
1.5 |
(69.0) |
— |
(69.0) |
||||||||||||||||||||||||||
|
Total Live Nation |
$ |
(293.3) |
$ |
80.2 |
$ |
(1.0) |
$ |
313.8 |
$ |
49.2 |
$ |
14.6 |
$ |
163.6 |
$ |
1.7 |
$ |
165.3 |
|||||||||||||||||
|
Nine Months Ended September 30, 2020 |
|||||||||||||||||||||||||||||||||||
|
Concerts |
$ |
(722.6) |
$ |
66.4 |
$ |
0.9 |
$ |
202.3 |
$ |
— |
$ |
(19.3) |
$ |
(472.3) |
$ |
— |
$ |
(472.3) |
|||||||||||||||||
|
Ticketing |
(480.5) |
11.2 |
— |
125.1 |
44.1 |
(0.7) |
(300.8) |
— |
(300.8) |
||||||||||||||||||||||||||
|
Sponsorship & Advertising |
40.8 |
5.2 |
— |
21.8 |
— |
(0.1) |
67.7 |
— |
67.7 |
||||||||||||||||||||||||||
|
Other & Eliminations |
(13.0) |
— |
— |
6.6 |
(5.3) |
— |
(11.7) |
— |
(11.7) |
||||||||||||||||||||||||||
|
Corporate |
(89.9) |
24.2 |
— |
9.0 |
— |
2.2 |
(54.5) |
— |
(54.5) |
||||||||||||||||||||||||||
|
Total Live Nation |
$ |
(1,265.2) |
$ |
107.0 |
$ |
0.9 |
$ |
364.8 |
$ |
38.8 |
$ |
(17.9) |
$ |
(771.6) |
$ |
— |
$ |
(771.6) |
|||||||||||||||||
|
LIVE NATION ENTERTAINMENT, INC. CONSOLIDATED BALANCE SHEETS (unaudited) |
|||||||
|
September 30, |
December 31, |
||||||
|
(in thousands) |
|||||||
|
ASSETS |
|||||||
|
Current assets |
|||||||
|
Cash and cash equivalents |
$ |
4,628,880 |
$ |
2,537,787 |
|||
|
Accounts receivable, less allowance of $53,116 and $72,904, respectively |
1,182,242 |
486,734 |
|||||
|
Prepaid expenses |
691,086 |
577,130 |
|||||
|
Restricted cash |
4,317 |
8,652 |
|||||
|
Other current assets |
48,766 |
39,465 |
|||||
|
Total current assets |
6,555,291 |
3,649,768 |
|||||
|
Property, plant and equipment, net |
1,041,854 |
1,101,414 |
|||||
|
Operating lease assets |
1,390,650 |
1,424,223 |
|||||
|
Intangible assets |
|||||||
|
Definite-lived intangible assets, net |
732,276 |
855,600 |
|||||
|
Indefinite-lived intangible assets |
369,016 |
369,058 |
|||||
|
Goodwill |
2,109,719 |
2,129,203 |
|||||
|
Long-term advances |
651,794 |
668,756 |
|||||
|
Other long-term assets |
480,144 |
391,281 |
|||||
|
Total assets |
$ |
13,330,744 |
$ |
10,589,303 |
|||
|
LIABILITIES AND EQUITY |
|||||||
|
Current liabilities |
|||||||
|
Accounts payable, client accounts |
$ |
1,499,131 |
$ |
744,096 |
|||
|
Accounts payable |
111,142 |
86,356 |
|||||
|
Accrued expenses |
1,445,840 |
894,149 |
|||||
|
Deferred revenue |
2,303,373 |
1,839,323 |
|||||
|
Current portion of long-term debt, net |
46,214 |
53,415 |
|||||
|
Current portion of operating lease liabilities |
111,090 |
107,147 |
|||||
|
Other current liabilities |
41,314 |
72,083 |
|||||
|
Total current liabilities |
5,558,104 |
3,796,569 |
|||||
|
Long-term debt, net |
5,686,905 |
4,855,096 |
|||||
|
Long-term operating lease liabilities |
1,448,270 |
1,445,674 |
|||||
|
Long-term deferred income taxes |
174,083 |
170,759 |
|||||
|
Other long-term liabilities |
242,811 |
182,508 |
|||||
|
Commitments and contingent liabilities |
|||||||
|
Redeemable noncontrolling interests |
262,347 |
272,449 |
|||||
|
Stockholders’ equity |
|||||||
|
Common stock |
2,218 |
2,145 |
|||||
|
Additional paid-in capital |
2,903,613 |
2,386,790 |
|||||
|
Accumulated deficit |
(3,132,813) |
(2,676,833) |
|||||
|
Cost of shares held in treasury |
(6,865) |
(6,865) |
|||||
|
Accumulated other comprehensive loss |
(170,997) |
(177,009) |
|||||
|
Total Live Nation stockholders’ equity |
(404,844) |
(471,772) |
|||||
|
Noncontrolling interests |
363,068 |
338,020 |
|||||
|
Total equity |
(41,776) |
(133,752) |
|||||
|
Total liabilities and equity |
$ |
13,330,744 |
$ |
10,589,303 |
|||
|
LIVE NATION ENTERTAINMENT, INC. CONSOLIDATED STATEMENTS OF OPERATIONS (unaudited) |
|||||||||||||||
|
Three Months Ended September 30, |
Nine Months Ended September 30, |
||||||||||||||
|
2021 |
2020 |
2021 |
2020 |
||||||||||||
|
(in thousands, except share and per share data) |
|||||||||||||||
|
Revenue |
$ |
2,698,722 |
$ |
184,018 |
$ |
3,565,277 |
$ |
1,623,795 |
|||||||
|
Operating expenses: |
|||||||||||||||
|
Direct operating expenses |
1,969,912 |
130,749 |
2,346,998 |
1,199,126 |
|||||||||||
|
Selling, general and administrative expenses |
446,929 |
405,934 |
1,098,676 |
1,243,307 |
|||||||||||
|
Depreciation and amortization |
101,235 |
119,938 |
313,758 |
364,785 |
|||||||||||
|
Loss (gain) on disposal of operating assets |
(1,148) |
208 |
(1,038) |
897 |
|||||||||||
|
Corporate expenses |
44,649 |
31,630 |
100,195 |
80,858 |
|||||||||||
|
Operating income (loss) |
137,145 |
(504,441) |
(293,312) |
(1,265,178) |
|||||||||||
|
Interest expense |
70,407 |
66,093 |
210,146 |
162,781 |
|||||||||||
|
Interest income |
(1,333) |
(2,810) |
(3,953) |
(9,712) |
|||||||||||
|
Equity in losses (earnings) of nonconsolidated affiliates |
(7,025) |
2,615 |
(4,608) |
6,656 |
|||||||||||
|
Gain from sale of investments in nonconsolidated affiliates |
(30,633) |
(2,514) |
(83,580) |
(2,479) |
|||||||||||
|
Other expense (income), net |
12,441 |
(8,463) |
19,903 |
(9,043) |
|||||||||||
|
Income (loss) before income taxes |
93,288 |
(559,362) |
(431,220) |
(1,413,381) |
|||||||||||
|
Income tax expense (benefit) |
6,421 |
(16,904) |
15,095 |
(49,417) |
|||||||||||
|
Net income (loss) |
86,867 |
(542,458) |
(446,315) |
(1,363,964) |
|||||||||||
|
Net income (loss) attributable to noncontrolling interests |
39,989 |
(13,556) |
9,665 |
(82,761) |
|||||||||||
|
Net income (loss) attributable to common stockholders of Live Nation |
$ |
46,878 |
$ |
(528,902) |
$ |
(455,980) |
$ |
(1,281,203) |
|||||||
|
Basic net income (loss) per common share available to common stockholders of Live Nation |
$ |
0.20 |
$ |
(2.45) |
$ |
(2.13) |
$ |
(6.08) |
|||||||
|
Diluted net income (loss) per common share available to common stockholders of Live Nation |
$ |
0.19 |
$ |
(2.45) |
$ |
(2.13) |
$ |
(6.08) |
|||||||
|
Weighted average common shares outstanding: |
|||||||||||||||
|
Basic and diluted |
216,888,355 |
212,593,719 |
215,716,239 |
211,781,620 |
|||||||||||
|
Diluted |
223,800,400 |
212,593,719 |
215,716,239 |
211,781,620 |
|||||||||||
|
Reconciliation to net income (loss) available to common stockholders of Live Nation: |
|||||||||||||||
|
Net income (loss) attributable to common stockholders of Live Nation |
$ |
46,878 |
$ |
(528,902) |
$ |
(455,980) |
$ |
(1,281,203) |
|||||||
|
Accretion of redeemable noncontrolling interests |
(4,245) |
6,990 |
(4,210) |
(5,955) |
|||||||||||
|
Basic and diluted net income (loss) available to common stockholders of Live Nation |
$ |
42,633 |
$ |
(521,912) |
$ |
(460,190) |
$ |
(1,287,158) |
|||||||
|
LIVE NATION ENTERTAINMENT, INC. CONSOLIDATED STATEMENTS OF CASH FLOWS (unaudited) |
|||||||
|
Nine Months Ended September 30, |
|||||||
|
2021 |
2020 |
||||||
|
(in thousands) |
|||||||
|
CASH FLOWS FROM OPERATING ACTIVITIES |
|||||||
|
Net loss |
$ |
(446,315) |
$ |
(1,363,964) |
|||
|
Reconciling items: |
|||||||
|
Depreciation |
167,170 |
184,391 |
|||||
|
Amortization |
146,588 |
180,394 |
|||||
|
Amortization of non-recoupable ticketing contract advances |
49,214 |
38,833 |
|||||
|
Deferred income tax expense (benefit) |
4,365 |
(22,615) |
|||||
|
Amortization of debt issuance costs and discounts |
27,916 |
24,201 |
|||||
|
Non-cash compensation expense |
80,165 |
106,965 |
|||||
|
Unrealized changes in fair value of contingent consideration |
(6,998) |
(25,745) |
|||||
|
Equity in losses of nonconsolidated affiliates, net of distributions |
6,396 |
8,266 |
|||||
|
Provision for uncollectible accounts receivable |
(14,006) |
48,413 |
|||||
|
Gain on sale of investments in nonconsolidated affiliates |
(83,580) |
(2,479) |
|||||
|
Other, net |
2,015 |
(12,681) |
|||||
|
Changes in operating assets and liabilities, net of effects of acquisitions and dispositions: |
|||||||
|
Decrease (increase) in accounts receivable |
(690,105) |
406,202 |
|||||
|
Decrease (increase) in prepaid expenses and other assets |
(92,635) |
1,793 |
|||||
|
Increase (decrease) in accounts payable, accrued expenses and other liabilities |
1,323,448 |
(1,213,409) |
|||||
|
Increase in deferred revenue |
551,059 |
684,532 |
|||||
|
Net cash provided by (used in) operating activities |
1,024,697 |
(956,903) |
|||||
|
CASH FLOWS FROM INVESTING ACTIVITIES |
|||||||
|
Advances of notes receivable |
(24,476) |
(12,232) |
|||||
|
Collections of notes receivable |
16,500 |
13,838 |
|||||
|
Investments made in nonconsolidated affiliates |
(55,246) |
(9,728) |
|||||
|
Purchases of property, plant and equipment |
(103,914) |
(187,036) |
|||||
|
Cash paid for acquisitions, net of cash acquired |
(19,594) |
(37,283) |
|||||
|
Proceeds from sale of investments in nonconsolidated affiliates |
80,593 |
3,753 |
|||||
|
Other, net |
(5,622) |
4,156 |
|||||
|
Net cash used in investing activities |
(111,759) |
(224,532) |
|||||
|
CASH FLOWS FROM FINANCING ACTIVITIES |
|||||||
|
Proceeds from long-term debt, net of debt issuance costs |
904,164 |
1,608,462 |
|||||
|
Payments on long-term debt |
(93,168) |
(24,202) |
|||||
|
Contributions from noncontrolling interests |
15,985 |
2,568 |
|||||
|
Distributions to noncontrolling interests |
(25,632) |
(31,473) |
|||||
|
Purchases and sales of noncontrolling interests, net |
(3,273) |
(106,971) |
|||||
|
Proceeds from exercise of stock options |
30,322 |
18,092 |
|||||
|
Proceeds from sale of common stock, net of issuance costs |
449,415 |
— |
|||||
|
Taxes paid for net share settlement of equity awards |
(42,731) |
(42,818) |
|||||
|
Payments for deferred and contingent consideration |
(12,845) |
(62,035) |
|||||
|
Other, net |
84 |
13 |
|||||
|
Net cash provided by financing activities |
1,222,321 |
1,361,636 |
|||||
|
Effect of exchange rate changes on cash, cash equivalents and restricted cash |
(48,501) |
(20,952) |
|||||
|
Net increase in cash, cash equivalents, and restricted cash |
2,086,758 |
159,249 |
|||||
|
Cash, cash equivalents and restricted cash at beginning of period |
2,546,439 |
2,474,242 |
|||||
|
Cash, cash equivalents and restricted cash at end of period |
$ |
4,633,197 |
$ |
2,633,491 |
|||
|
THIRD QUARTER 2021 Supplemental Earnings Tables (unaudited) |
|||
|
Free Cash & Cash Used in the Quarter |
|||
|
Changes to the company’s free cash balance from the end of second quarter of 2021 to the end of the third quarter of 2021 were as follows: |
|||
|
(in millions) |
|||
|
Free cash balance at 6/30/2021 |
$ |
1,103 |
|
|
Operational burn * |
(384) |
||
|
Non-operational cash uses, including capital expenditures, acquisition activity, net advances and interest payments |
(197) |
||
|
Operational contribution margin ** |
747 |
||
|
Draw down on Term Loan A |
400 |
||
|
Equity raise for OCESA acquisition |
449 |
||
|
Inflows / (outflows) from timing classification changes between short-term and long-term |
(371) |
||
|
Free cash balance at 9/30/2021 |
$ |
1,747 |
|
|
* Operational burn is our SG&A and Corporate costs less bonus, severance and bad debt. |
|||
|
** Operational contribution margin is our contribution margin less one-time items (Ticketing refunds, insurance recoveries, and artist advance reserves). |
|||
|
Event-Related Deferred Revenue |
|||
|
The company’s deferred revenue for events over the next 12 months was $1,869 million as of September 30, 2021, compared to $2,125 million as of June 30, 2021. The decrease was due to shows that played off and estimated refunds from Live Nation cash were partially offset by ticket sales in the third quarter and the shift from long-term deferred revenue. |
|||
|
(in millions) |
|||
|
Current Deferred Revenue as of 6/30/2021 |
$ |
2,125 |
|
|
Shift from long-term deferred revenue to current deferred revenue |
280 |
||
|
Adjustment to estimated additional future refunds from Live Nation-held cash |
20 |
||
|
Currency impacts |
(25) |
||
|
Ticket sales in the third quarter of 2021 |
474 |
||
|
Cash from shows that played off |
(841) |
||
|
Estimated refunds from Live Nation cash |
(174) |
||
|
Other / Net |
10 |
||
|
Current Deferred Revenue as of 9/30/2021 |
$ |
1,869 |
|
|
In addition, the company had approximately $101 million of long-term event-related deferred revenue at the end of the third quarter of 2021. |
|||